Hopper Paid Growth
Case Study

Setting
For a decade, the U.S. online travel industry was firmly controlled by Expedia Group and Booking Holdings, who together dominated the OTA (Online Travel Agency) market through scale, consolidation, and aggressive paid search strategies.
Expedia Group: $5.2 billion in 2020 revenue with approximately 14,800 employees.
Booking Holdings: $6.8 billion in 2020 revenue with approximately 20,300 employees.
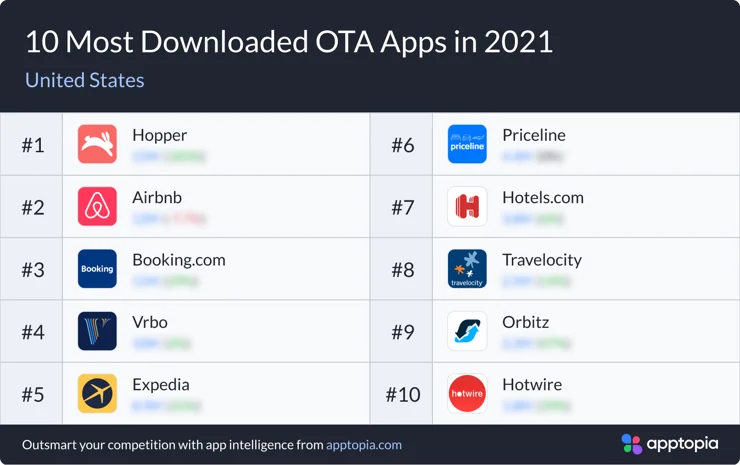
Between 2021 and 2022, Hopper—a mobile-first online travel agency—secured roughly half a billion dollars in funding to challenge the long-standing duopoly and rise from an unranked to top 3 player. Performance marketing became the primary lever for acquiring new users and scaling revenue.


Creative Process
Democratized testing results through creative dashboards, creating a real-time feedback loop to level up designers/agencies and increase ownership of outcomes.
Conducted quarterly reviews of Best and Worst ads to identify repeatable creative patterns.
Maintained a creative backlog tracker to ensure at least two weeks’ worth of fresh ads were always ready to combat fatigue.
This system scaled creative testing 10x per month, reduced CPIs by 40% while significantly increasing our winning batting average, and eliminated CPA volatility caused by creative fatigue—one of the biggest drivers of rising Paid Social costs.


Marketing Automation
Built dashboards to rank campaign performance for efficient budget allocation and daily breakdowns to catch performance deterioration early—triggering faster creative refreshes or campaign adjustments.
Automated creative refreshes to flag underperformers and highlight top creative tests based on available ad slots without manual review.
Set up automatic bid changes & uploads based on recent Google Search web-to-app performance.
This automation stack cut manual work by 95%, made optimization decisions proactive rather than reactive, and freed up team bandwidth to focus on value-additive initiatives.
Incrementality
Monitored Paid vs Organic user behavior—tracking conversion rates and in-app event usage—to catch “too good to be true” performance early.
Flagged unusual patterns like inflated click-through rates, impression-to-install rates, and view-through attribution percentages.
Modeled lift by analyzing Paid channel ramp-ups against Organic declines, carefully isolating seasonality to spot real cannibalization.
This process helped prevent millions in wasted spend and ensured our budget fueled true net-new growth.
